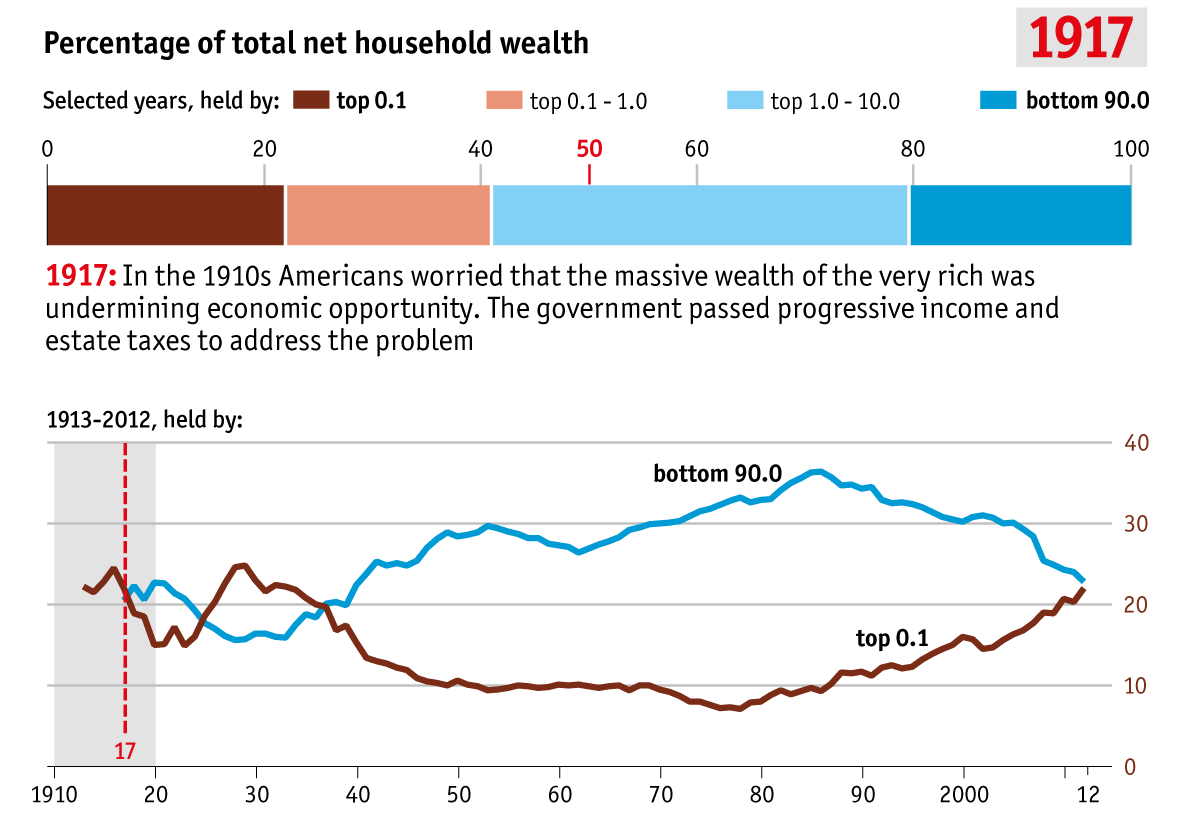
One major event coincided with the peak of middle class wealth and it was downhill from there:
Ronald Reagan was elected President of the USA, 1981-1989, and implemented major changes to the US economy that changed Americas future.
- lower taxes
- less welfare
- smaller government ie massive privatisation
Famous for his support of the” trickle down effect” where lower taxes on the rich supposedly trickled benefits down to those below, history and this graph show which way middle class wealth trickled under Ronald Reagan’s legacy and it was “out of their reach” and UP.
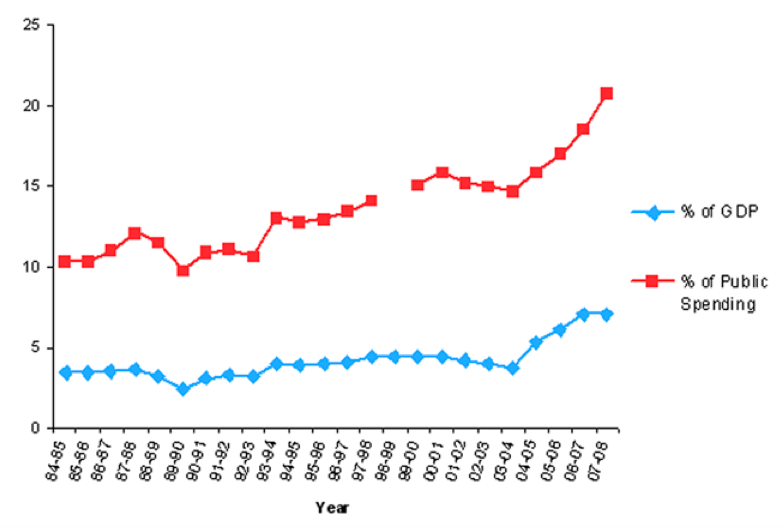
Before you dismiss the fate of America’s middle class, consider that while the public was distracted by the mining boom (that was not going to last), Prime Minister John Howard delivered tax cuts worth $38 billion a year (article May 2013).
Tax cuts include Tax expenditures (graph from the publication Reforming Australia’s Hidden Welfare State 2009 by Dr Ben Spiers-Butcher and Adam Stebbing).
Privatisation of government services is not so easy to measure because State governments have quietly been privatising along with headline grabbing Federal government privatisaions but few would disagree that it has been substantial.
Tony Abbott’s government even offers a funding reward for states that privatise services/assets.
The nett effect is that there is little to distinguish Ronald Reagan’s ideology from Australia’s low tax, reduce welfare and privatise ideology that John Howard gave a mighty impetus to.
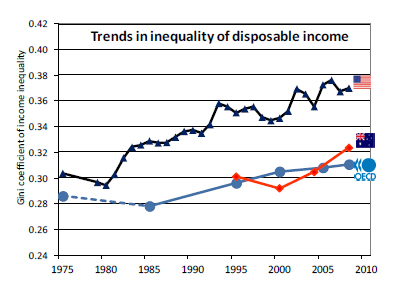
Finally an OECD graph showing the change in income inequality that occurred at the time of John Howard’s substantial tax cuts including the dramatic increase in tax expenditures (rebates, concessions etc).
The society we Australians are creating for our children and their children is described by Joseph E. Stiglitz, Economics Nobel Laureate and amongst his many roles, former Vice President of the World bank. (external link) Inequality and the American Child , Dec 2014.
-
19.9% of children – some 15 million individuals – live in poverty. Among developed countries, only Romania has a higher rate of child poverty. The US rate is two-thirds higher than that in the United Kingdom, and up to four times the rate in the Nordic countries.
-
Income inequality is correlated with inequalities in health, access to education, and exposure to environmental hazards, all of which burden children more than other segments of the population. Indeed, nearly one in five poor American children are diagnosed with asthma, a rate 60% higher than non-poor children. Learning disabilities occur almost twice as frequently among children in households earning less than $35,000 a year than they do in households earning more than $100,000.
And Australia? Children in poverty 17.7% (ACOSS 2014), not quite the US 19.9%.
Joseph Stigliz is currently based at Columbia University, USA but wrote an extremely relevant article July 9, 2014 (external link) American Delusion Down Under, well worth reading.